Track Engage email metrics including deliveries, opens, clicks, and leads generated directly from your dashboard.
View basic Engage performance:
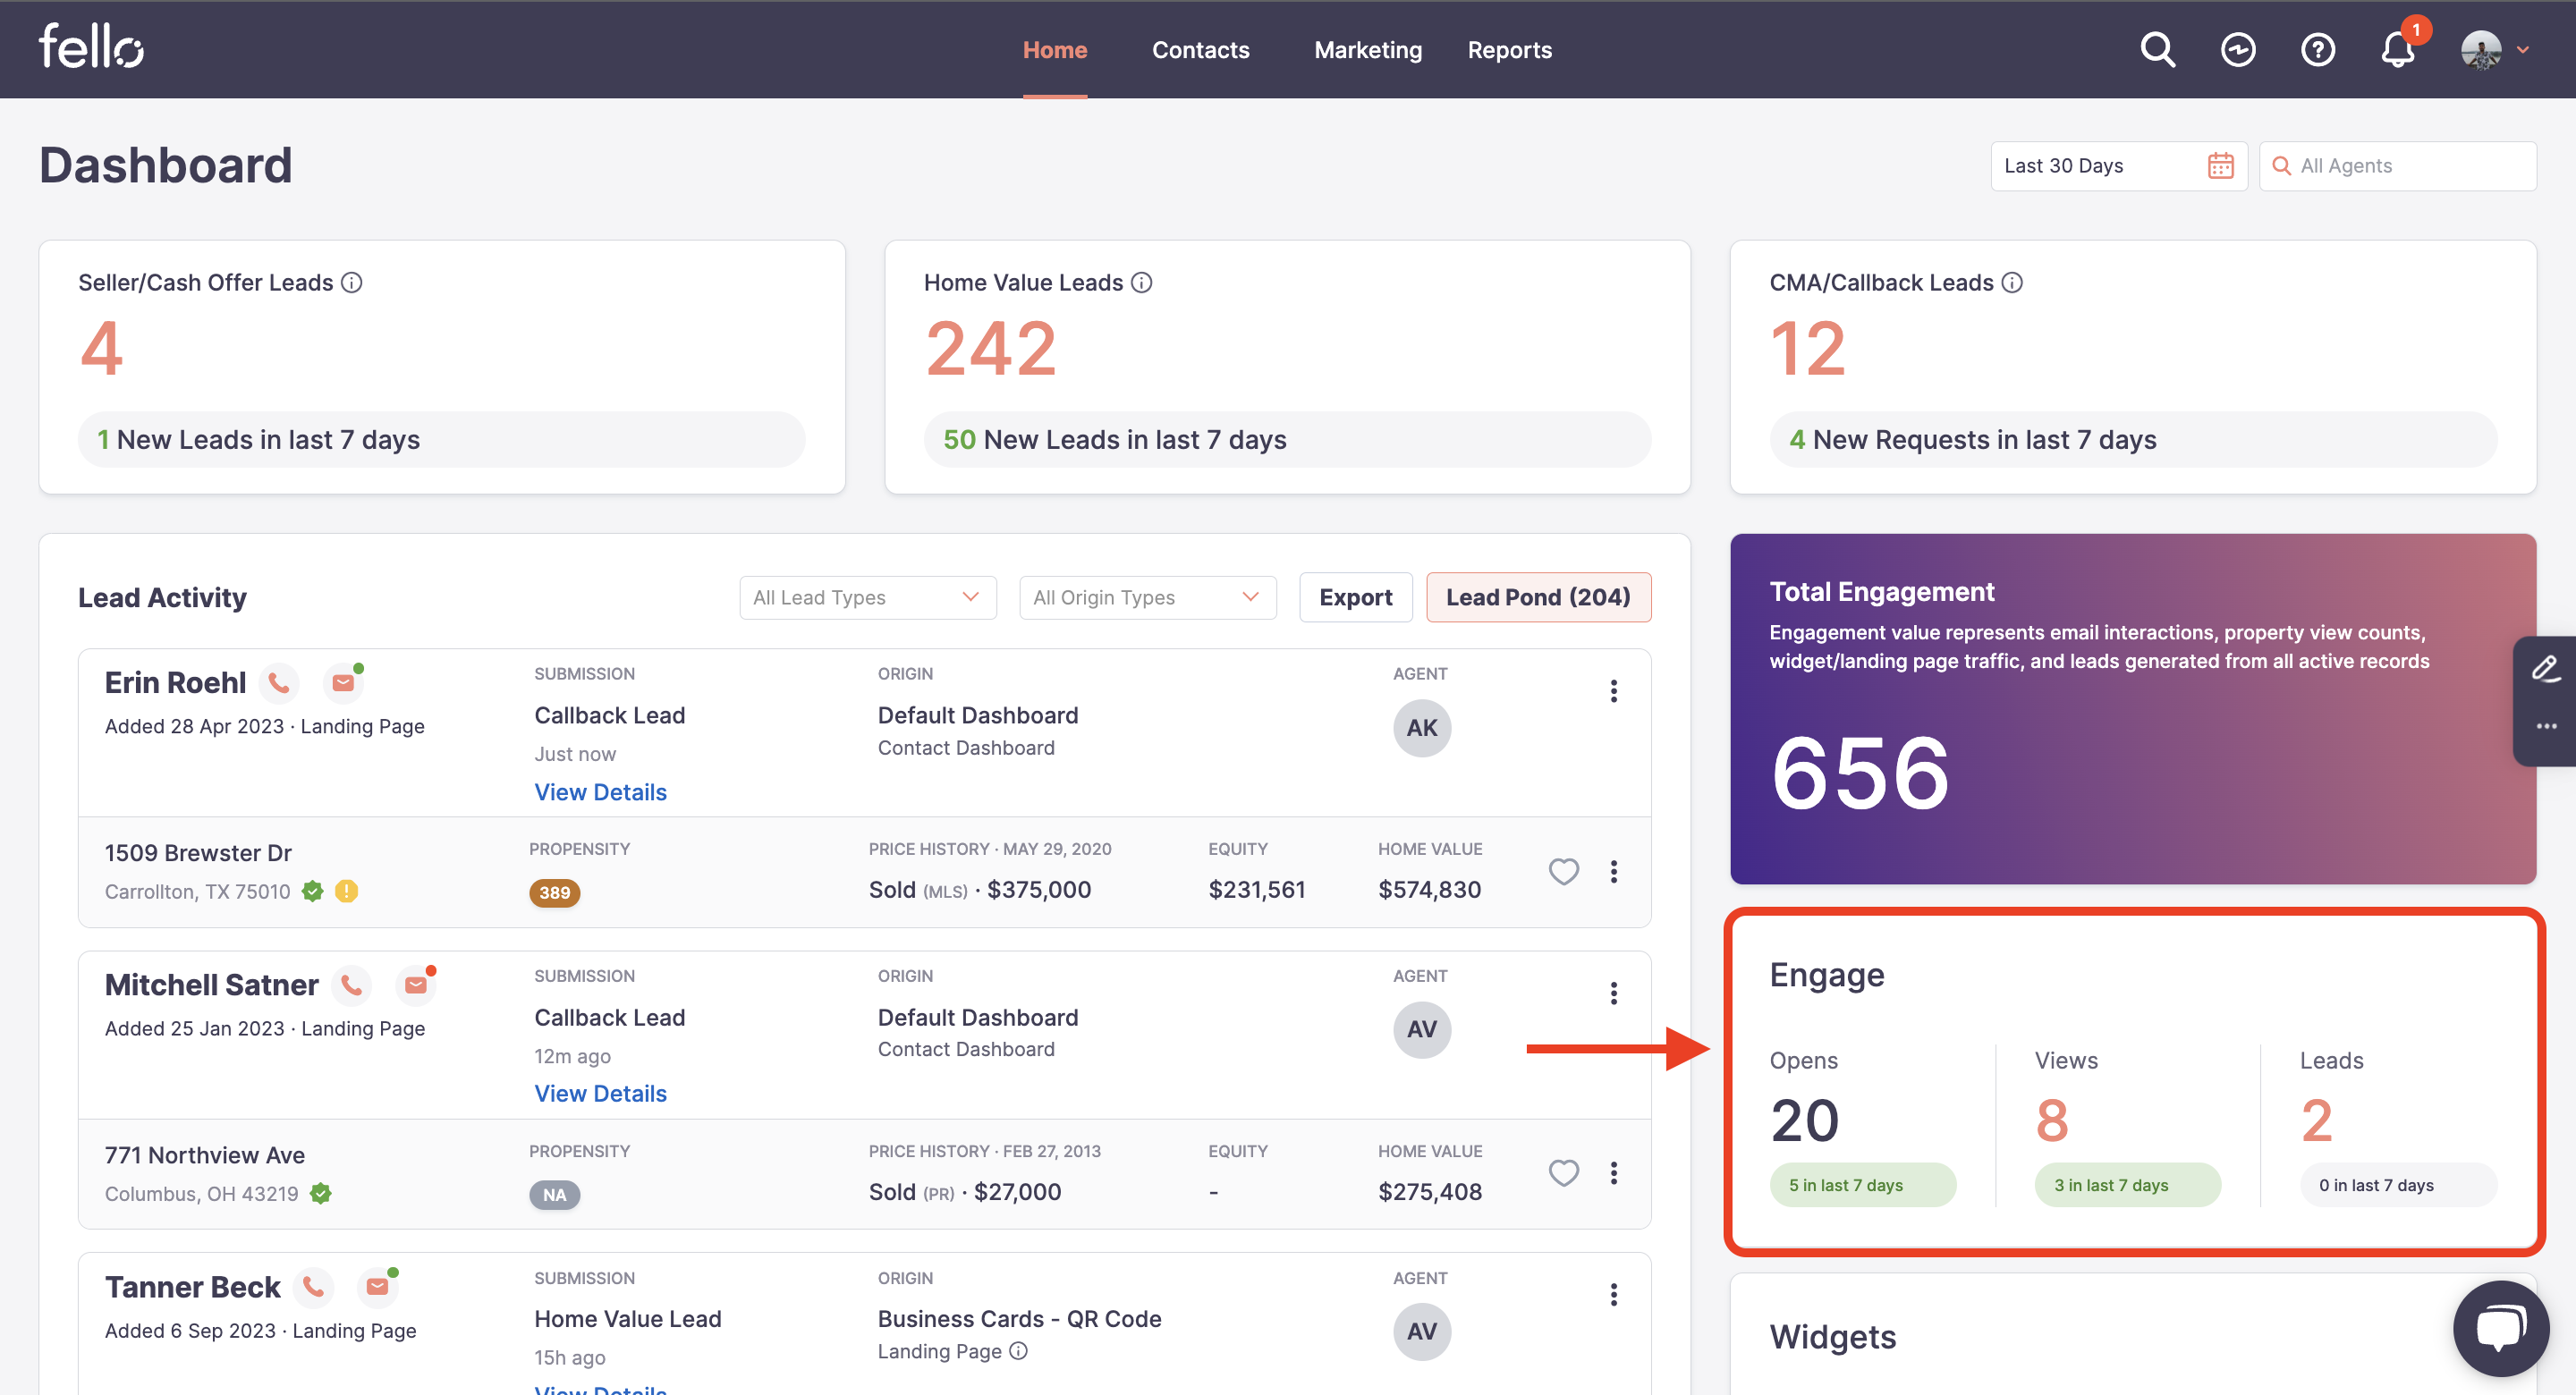
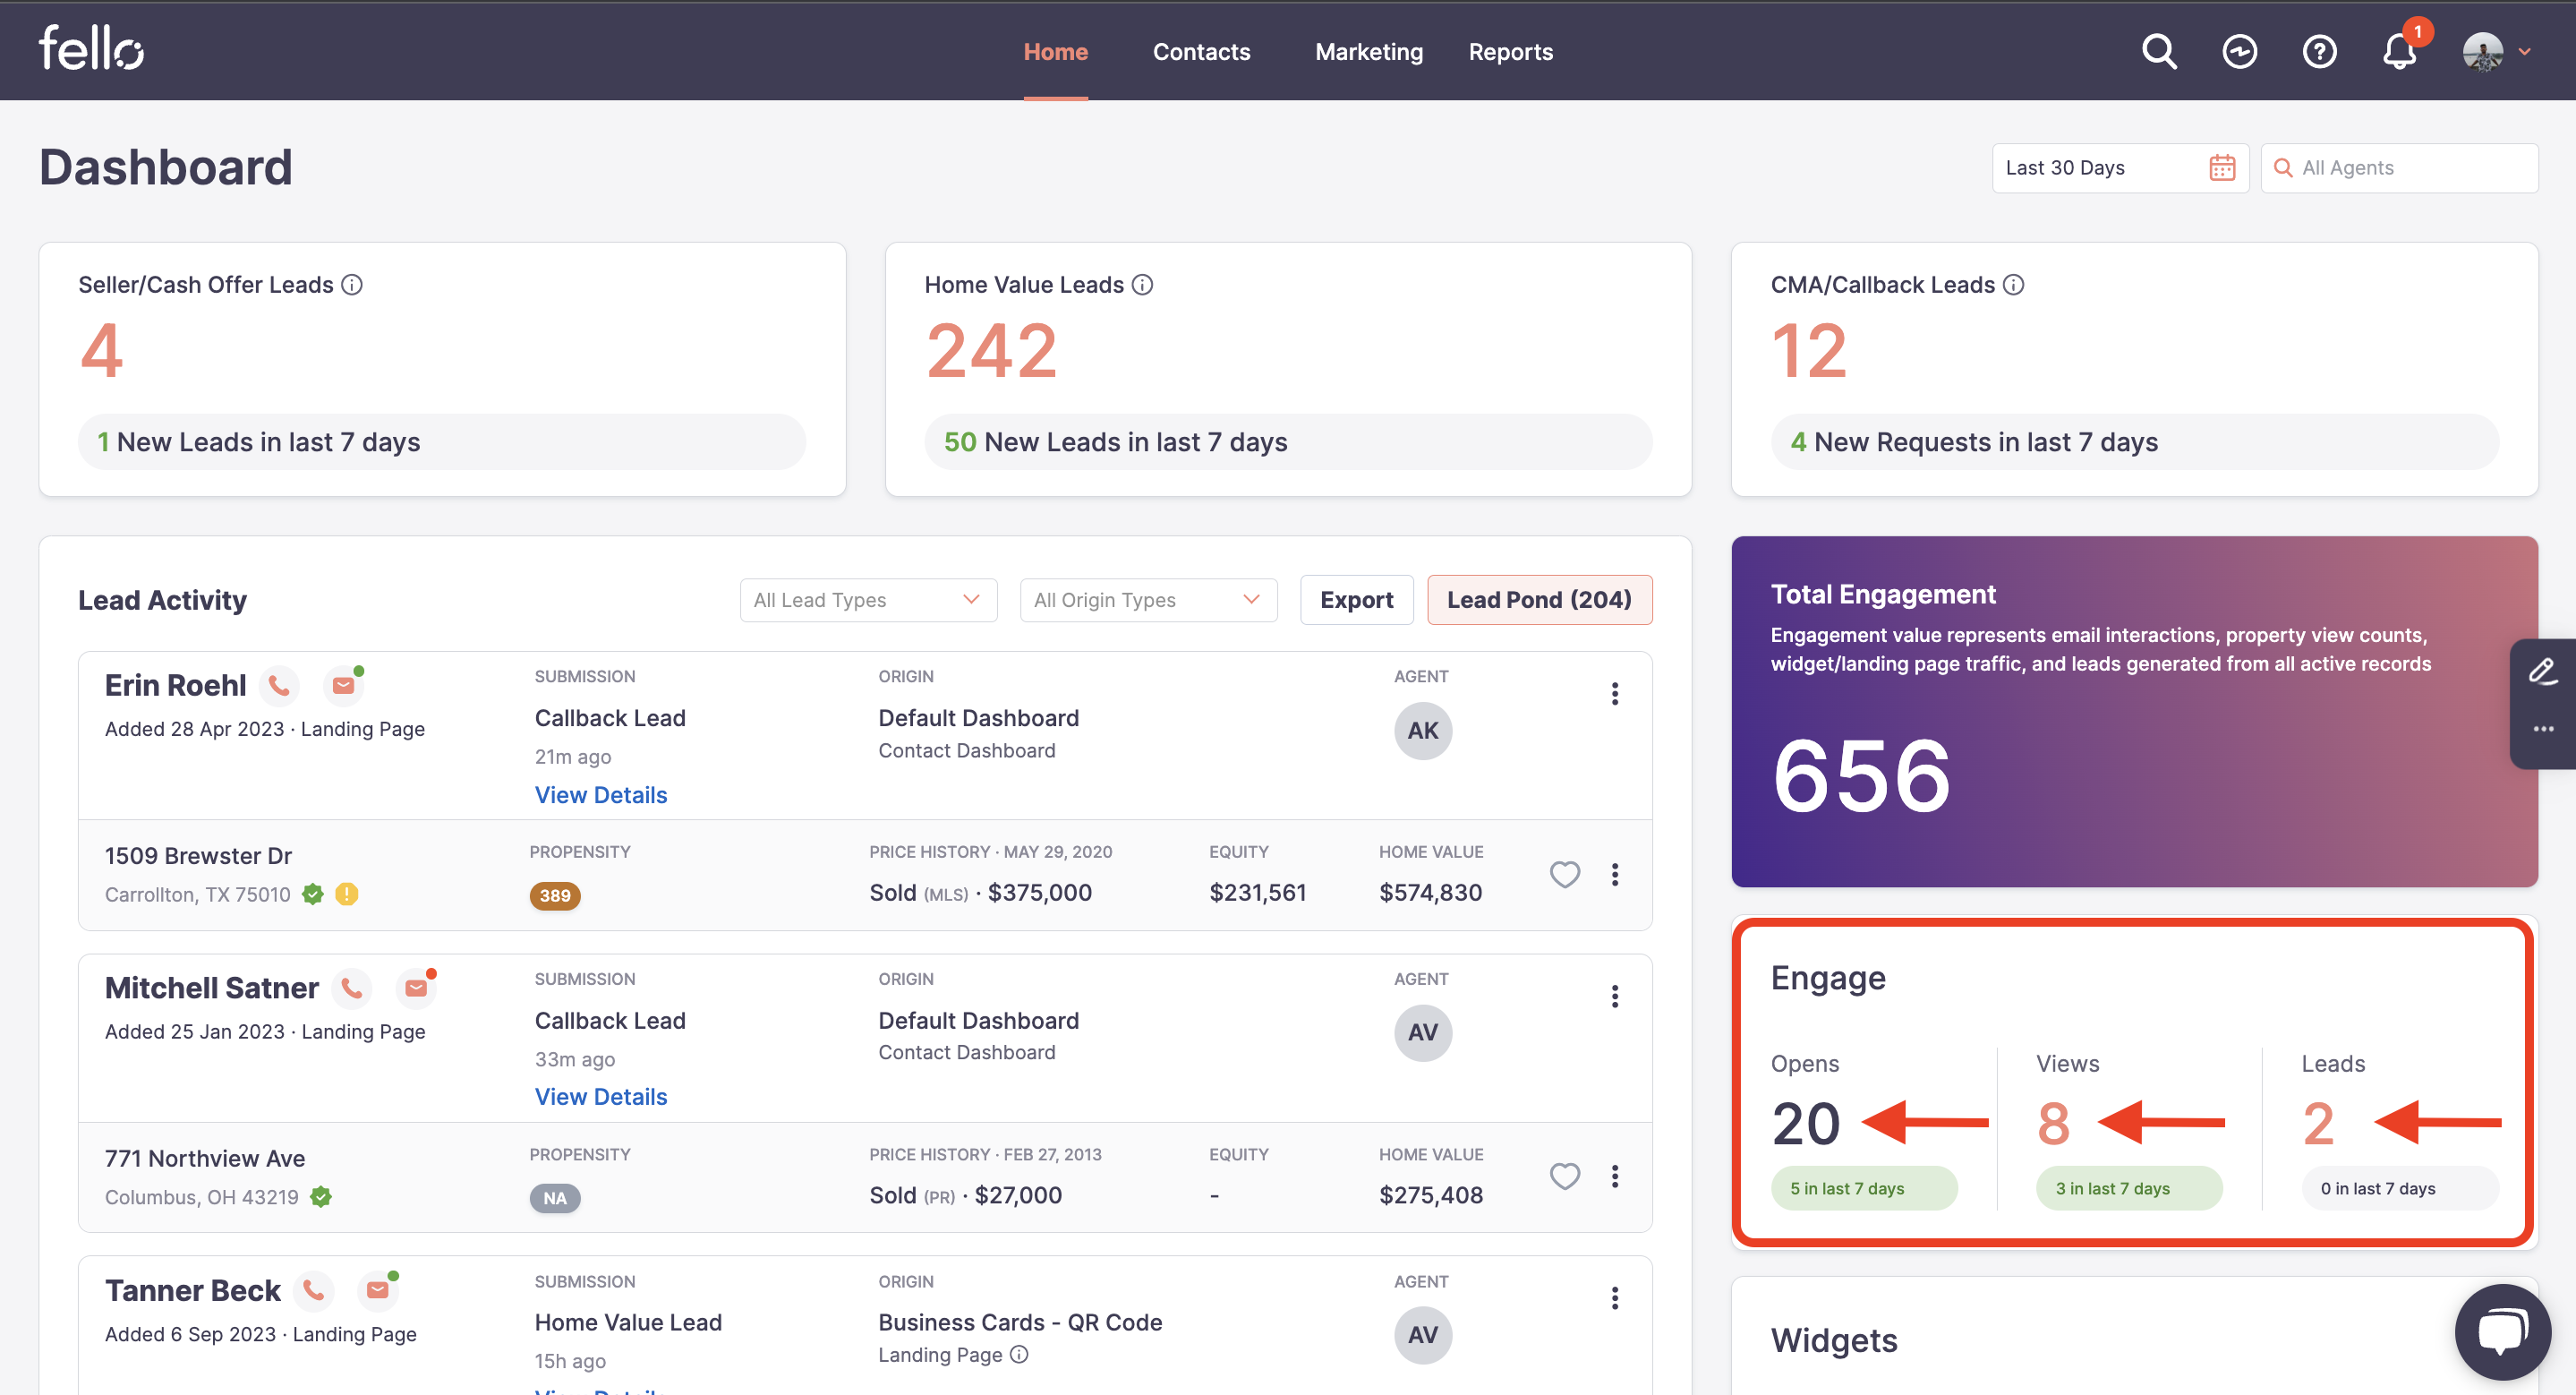
From the Home tab, scroll down to Engage Performance on the right.
You can filter to view performance metrics for a specific time period from the dropdown menu. 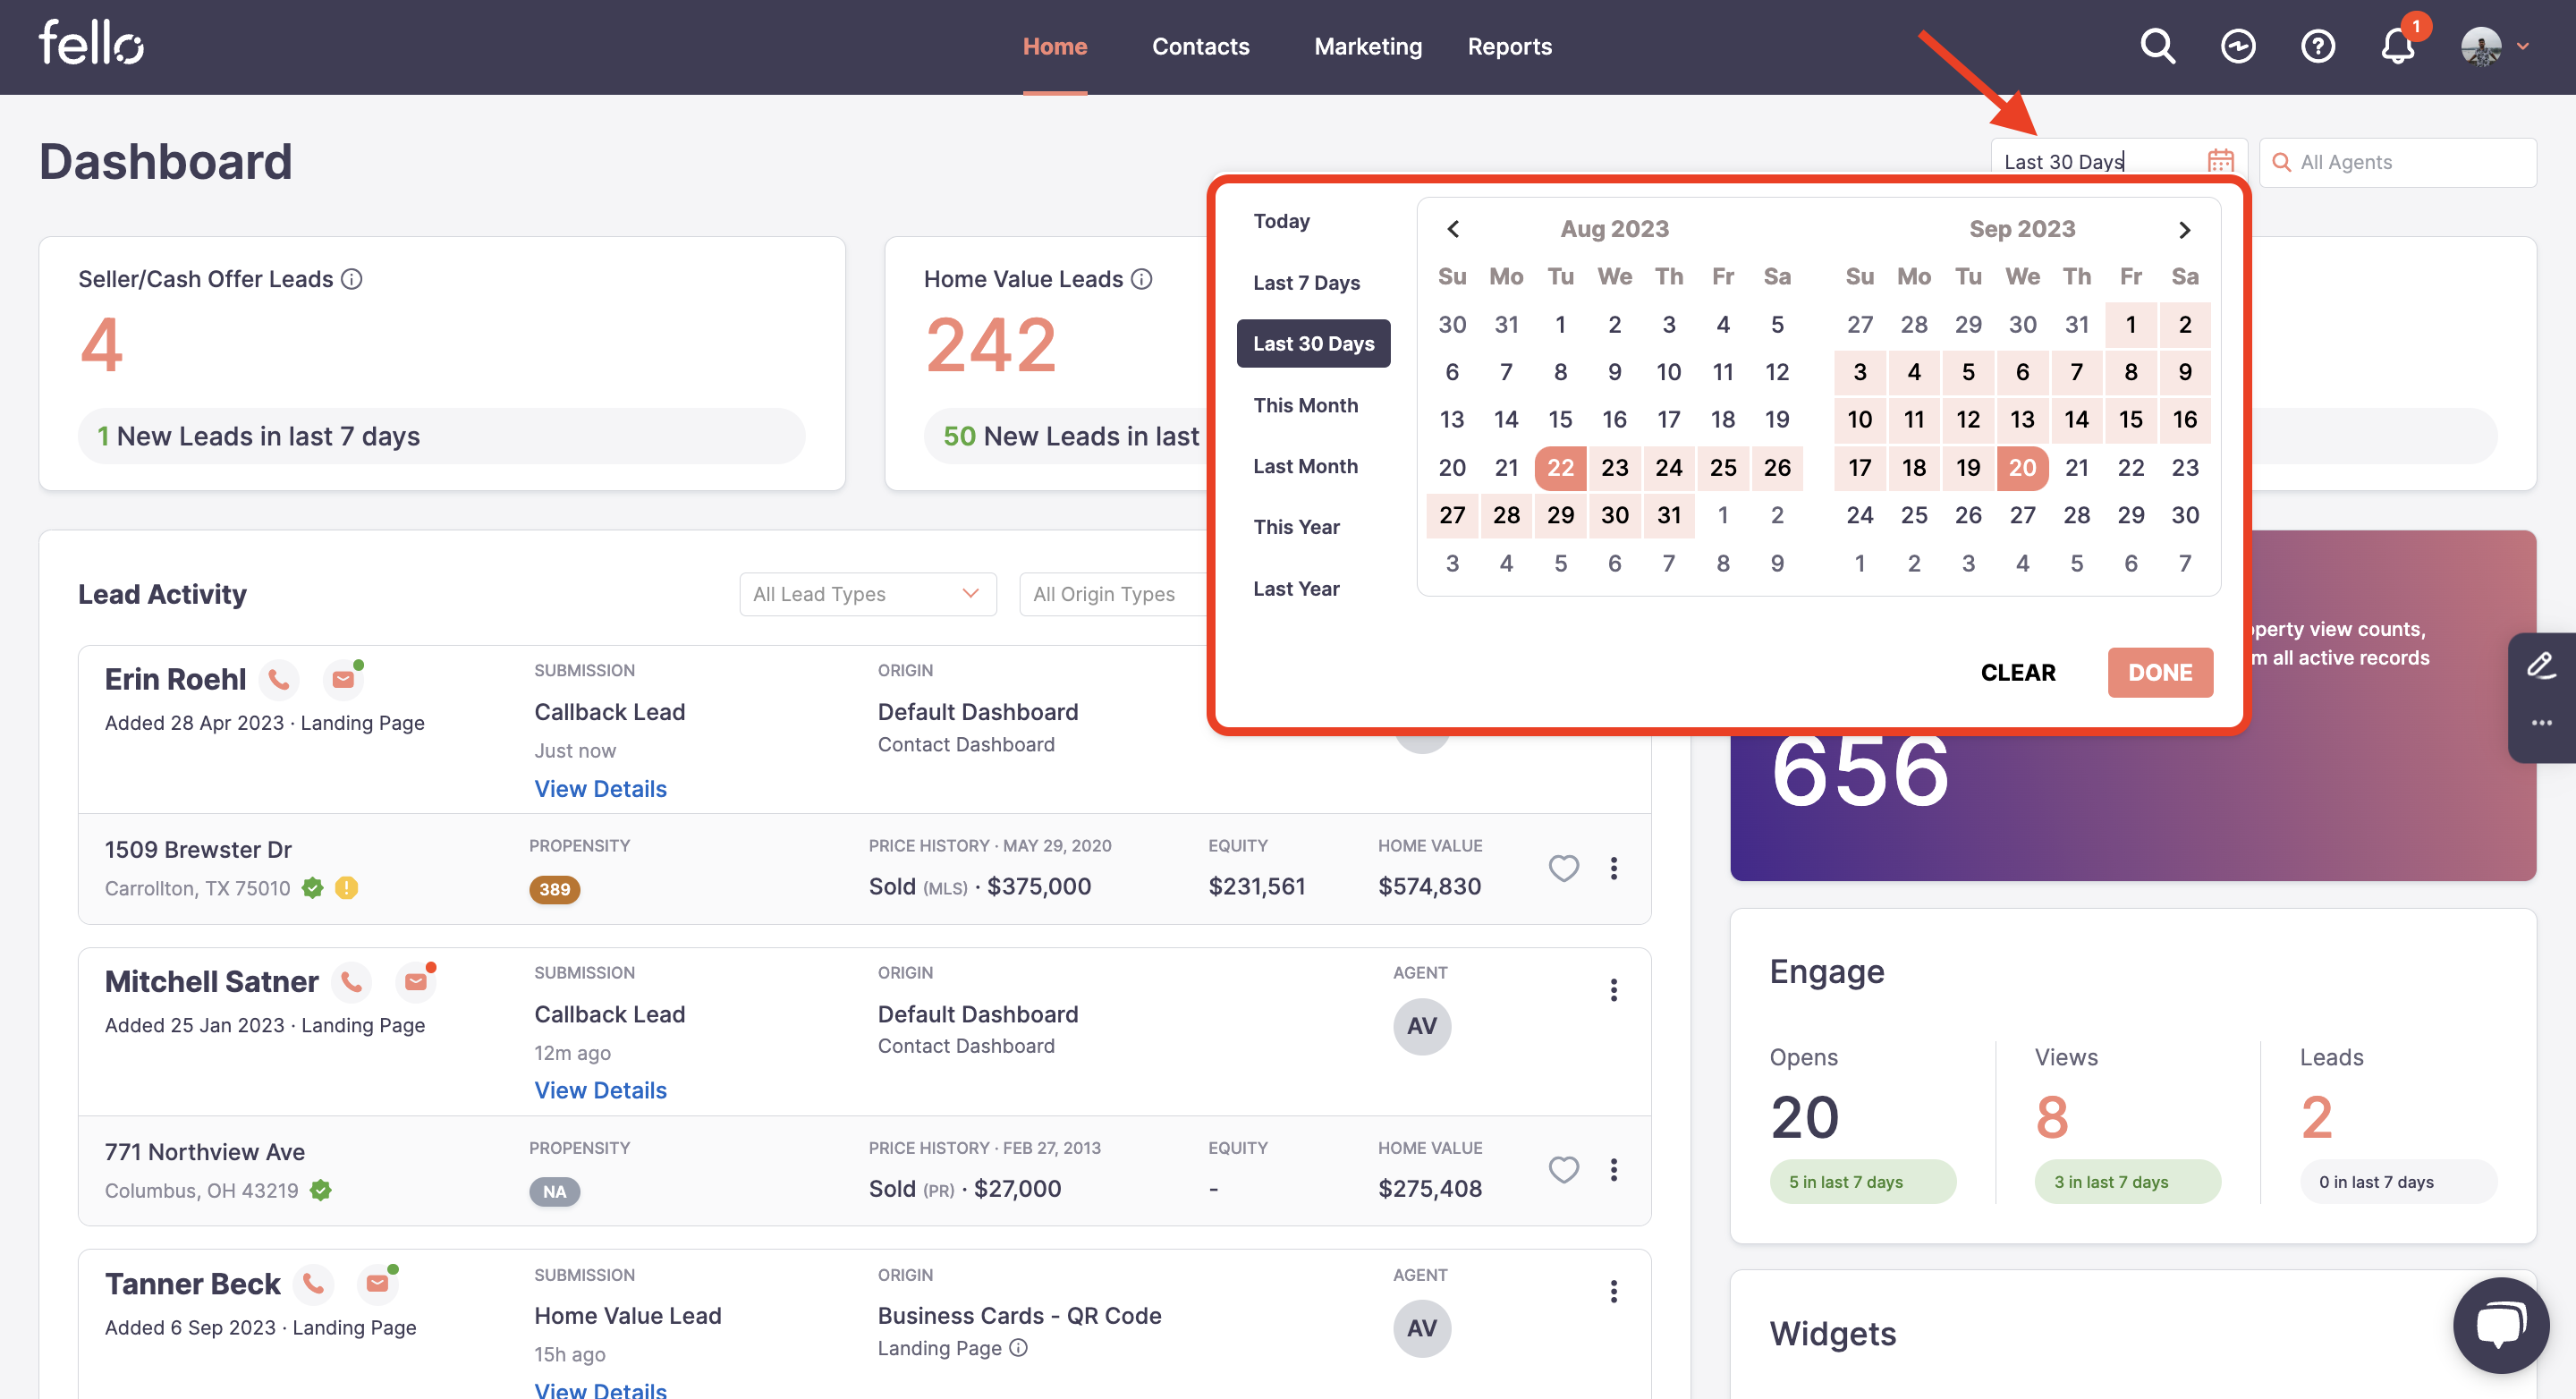
See how many contacts have opened Engage emails and viewed their home value and how many leads were generated by Engage during the selected time period.
View detailed Engage performance:
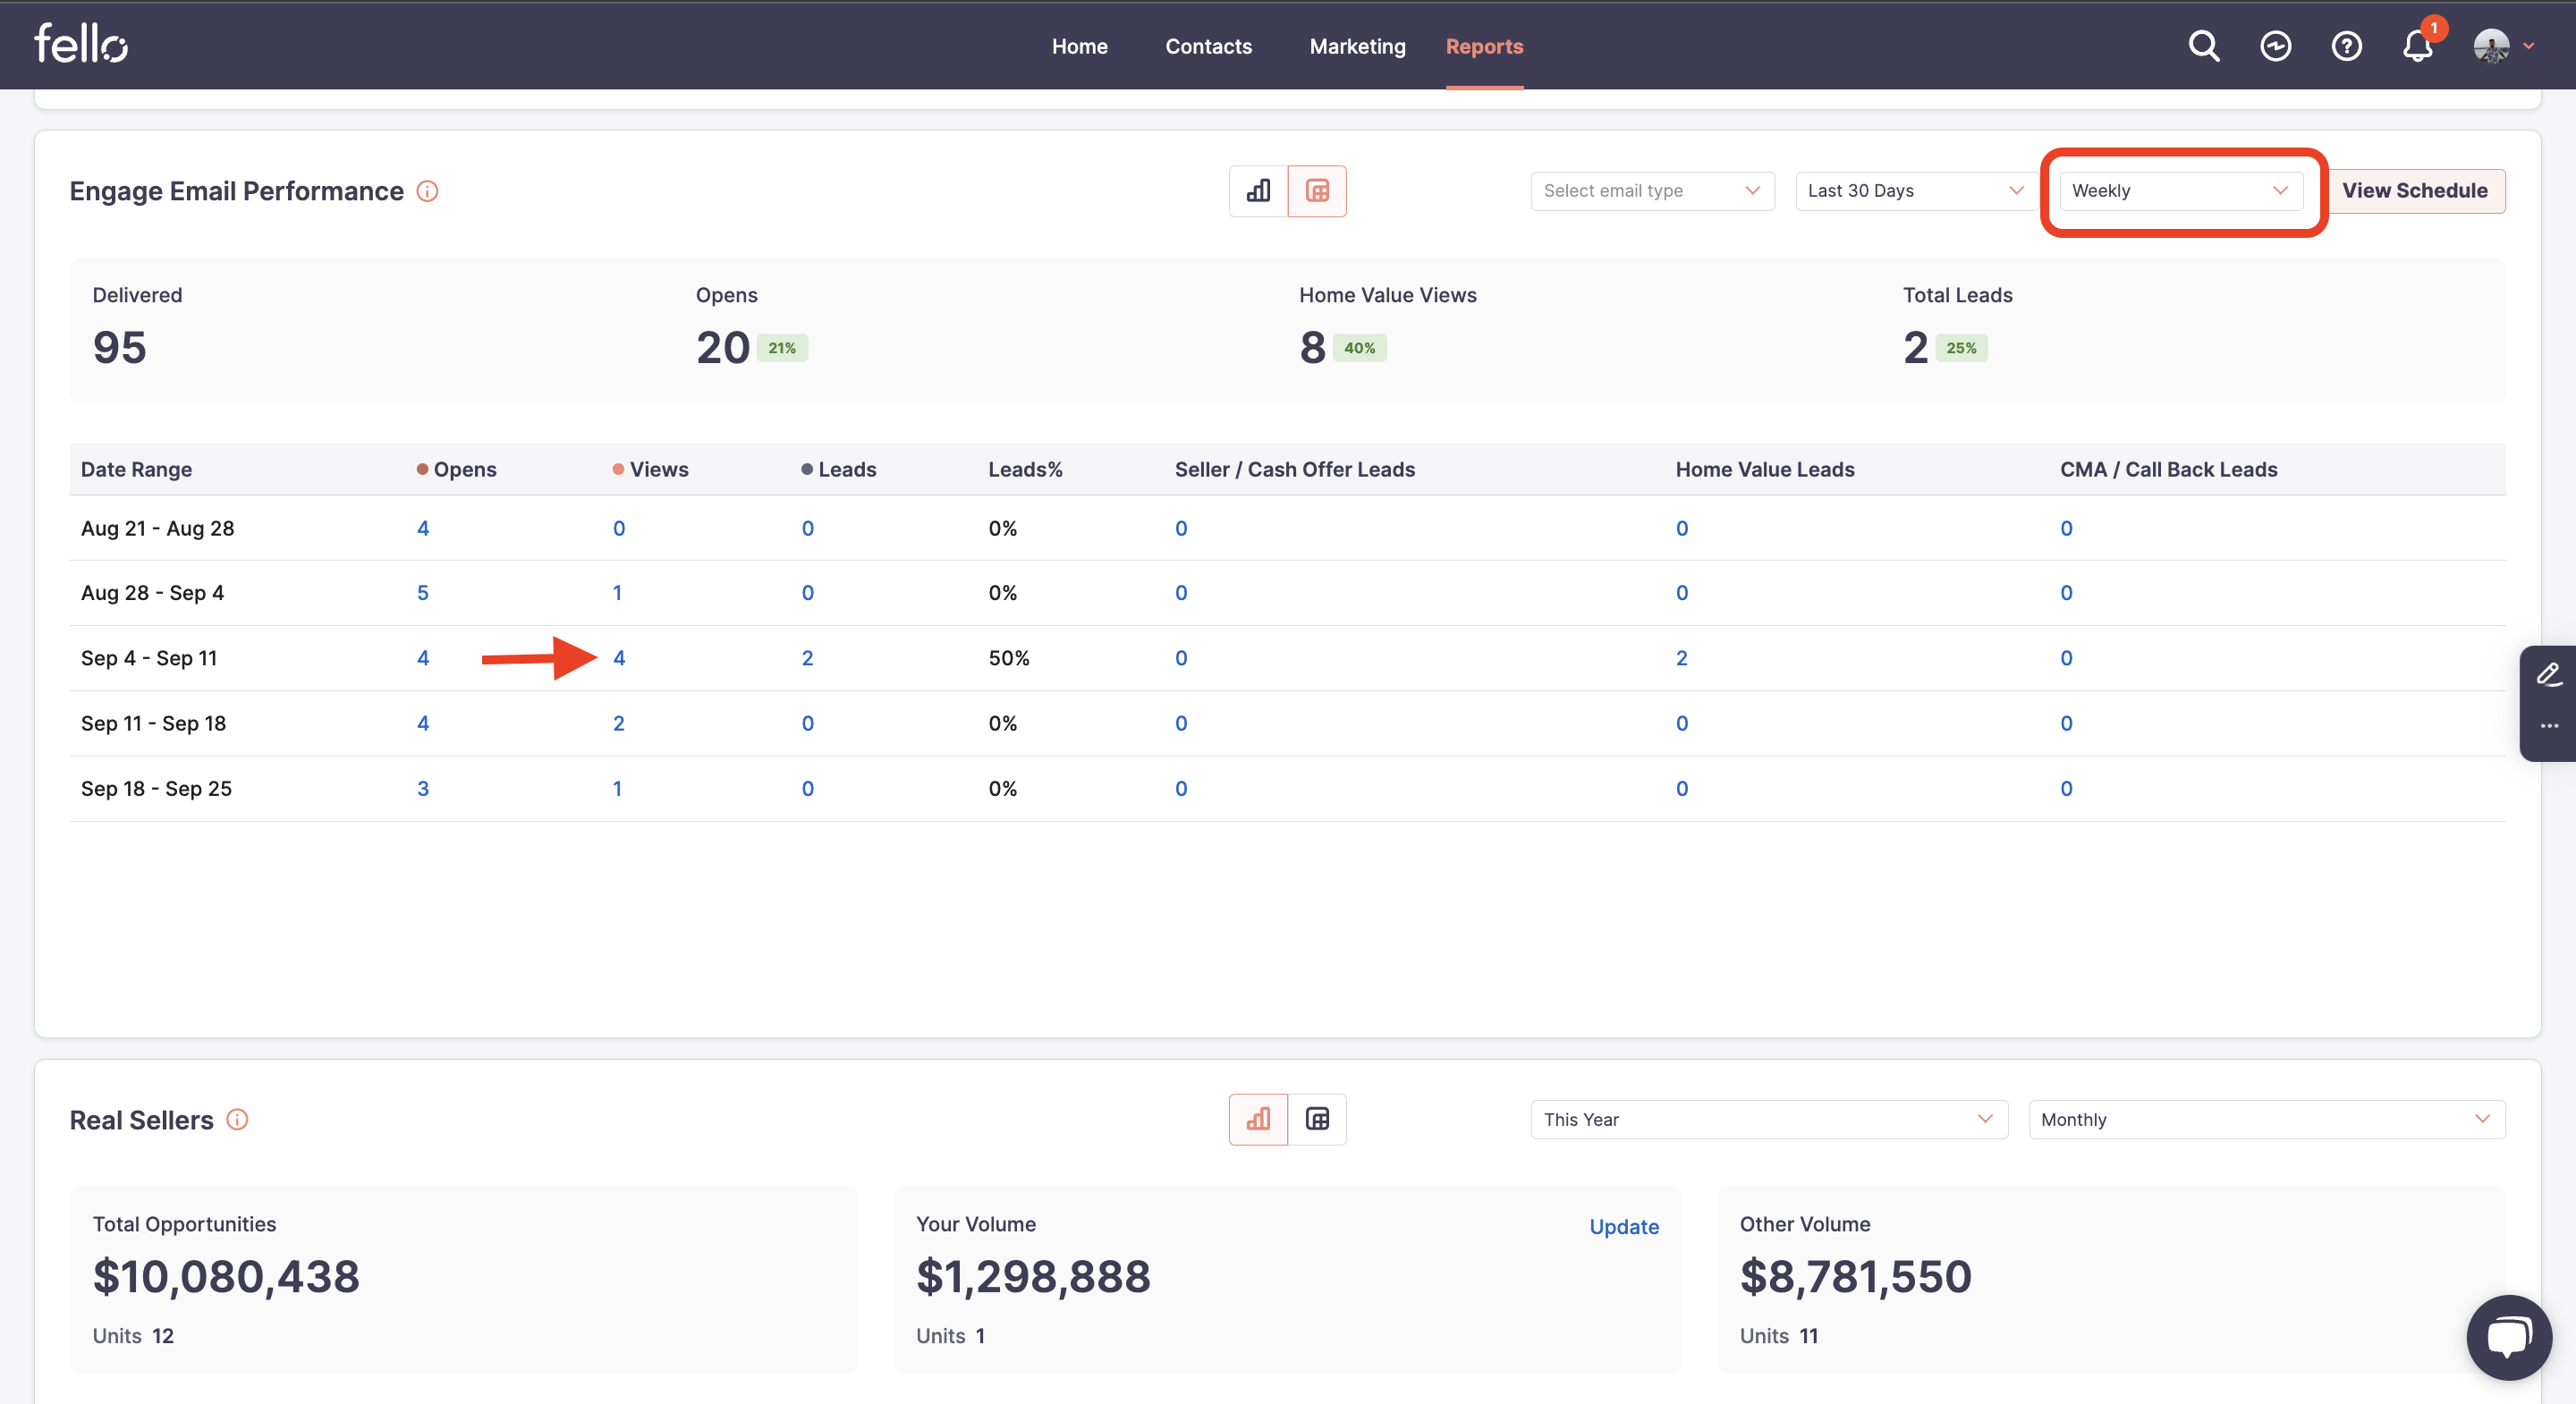
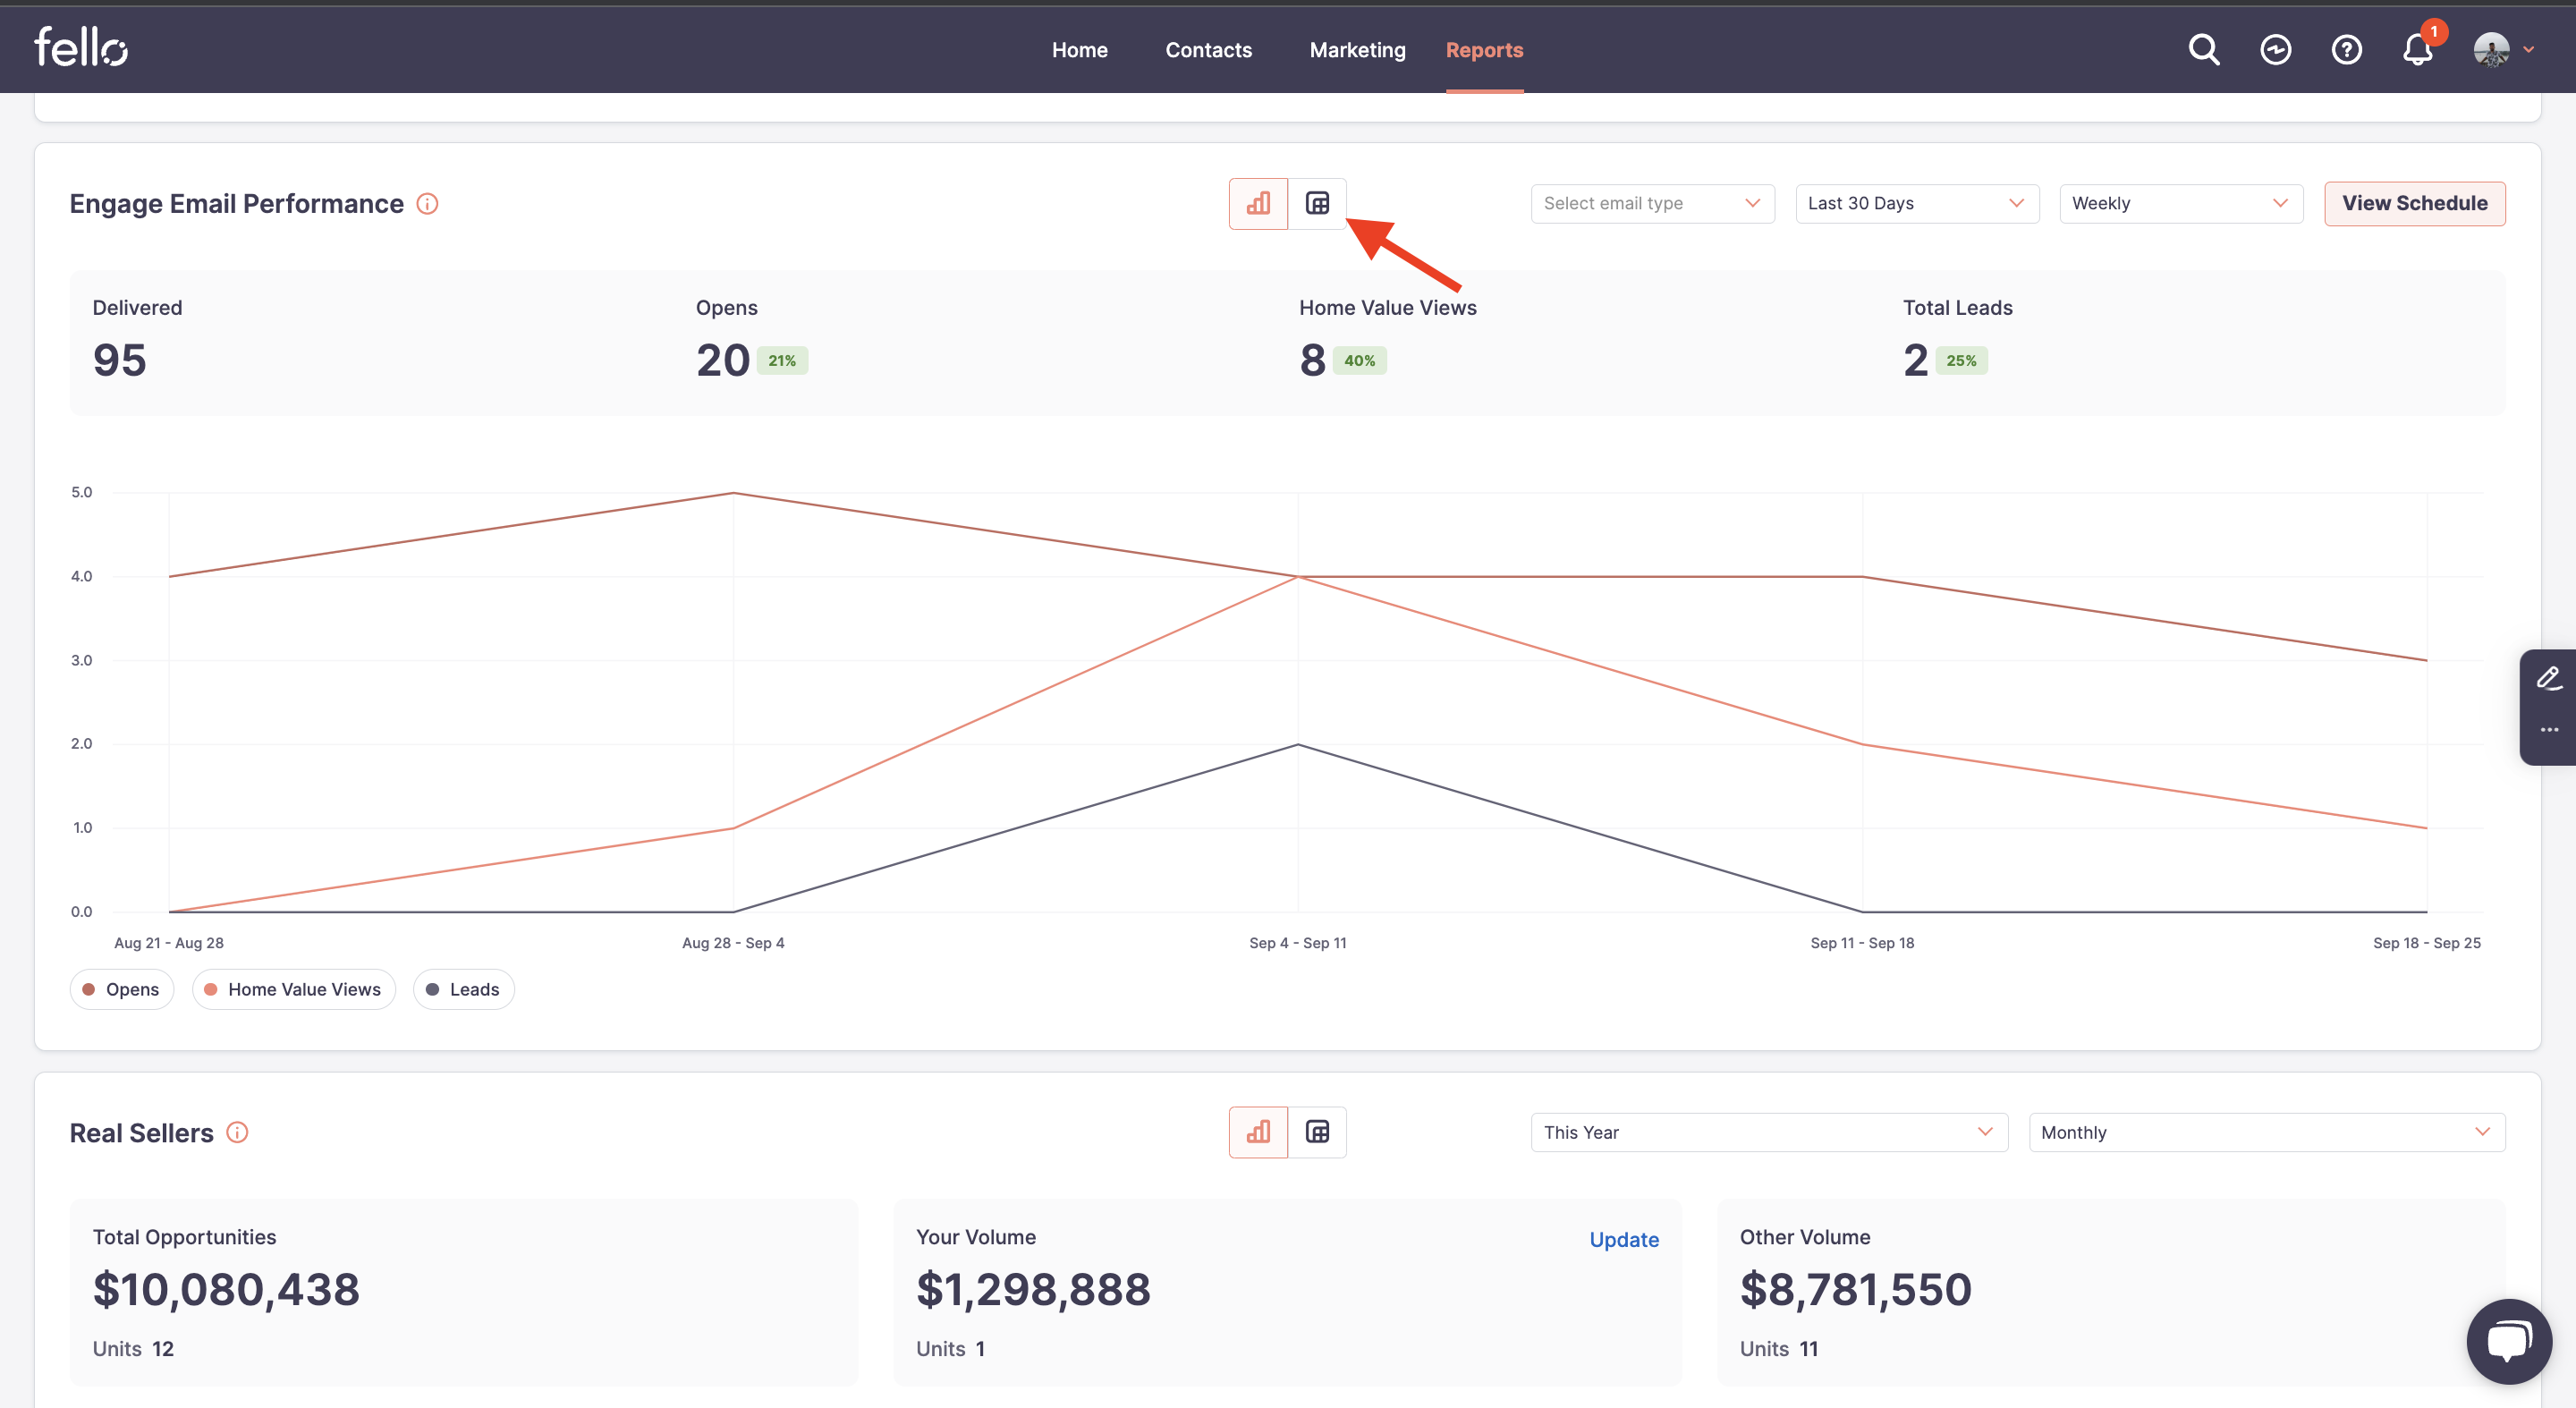
Go to the Reports tab and select the time period that you want to view metrics for from the dropdown menu. The default setting is the last 30 days and the chart data is displayed with weekly data.
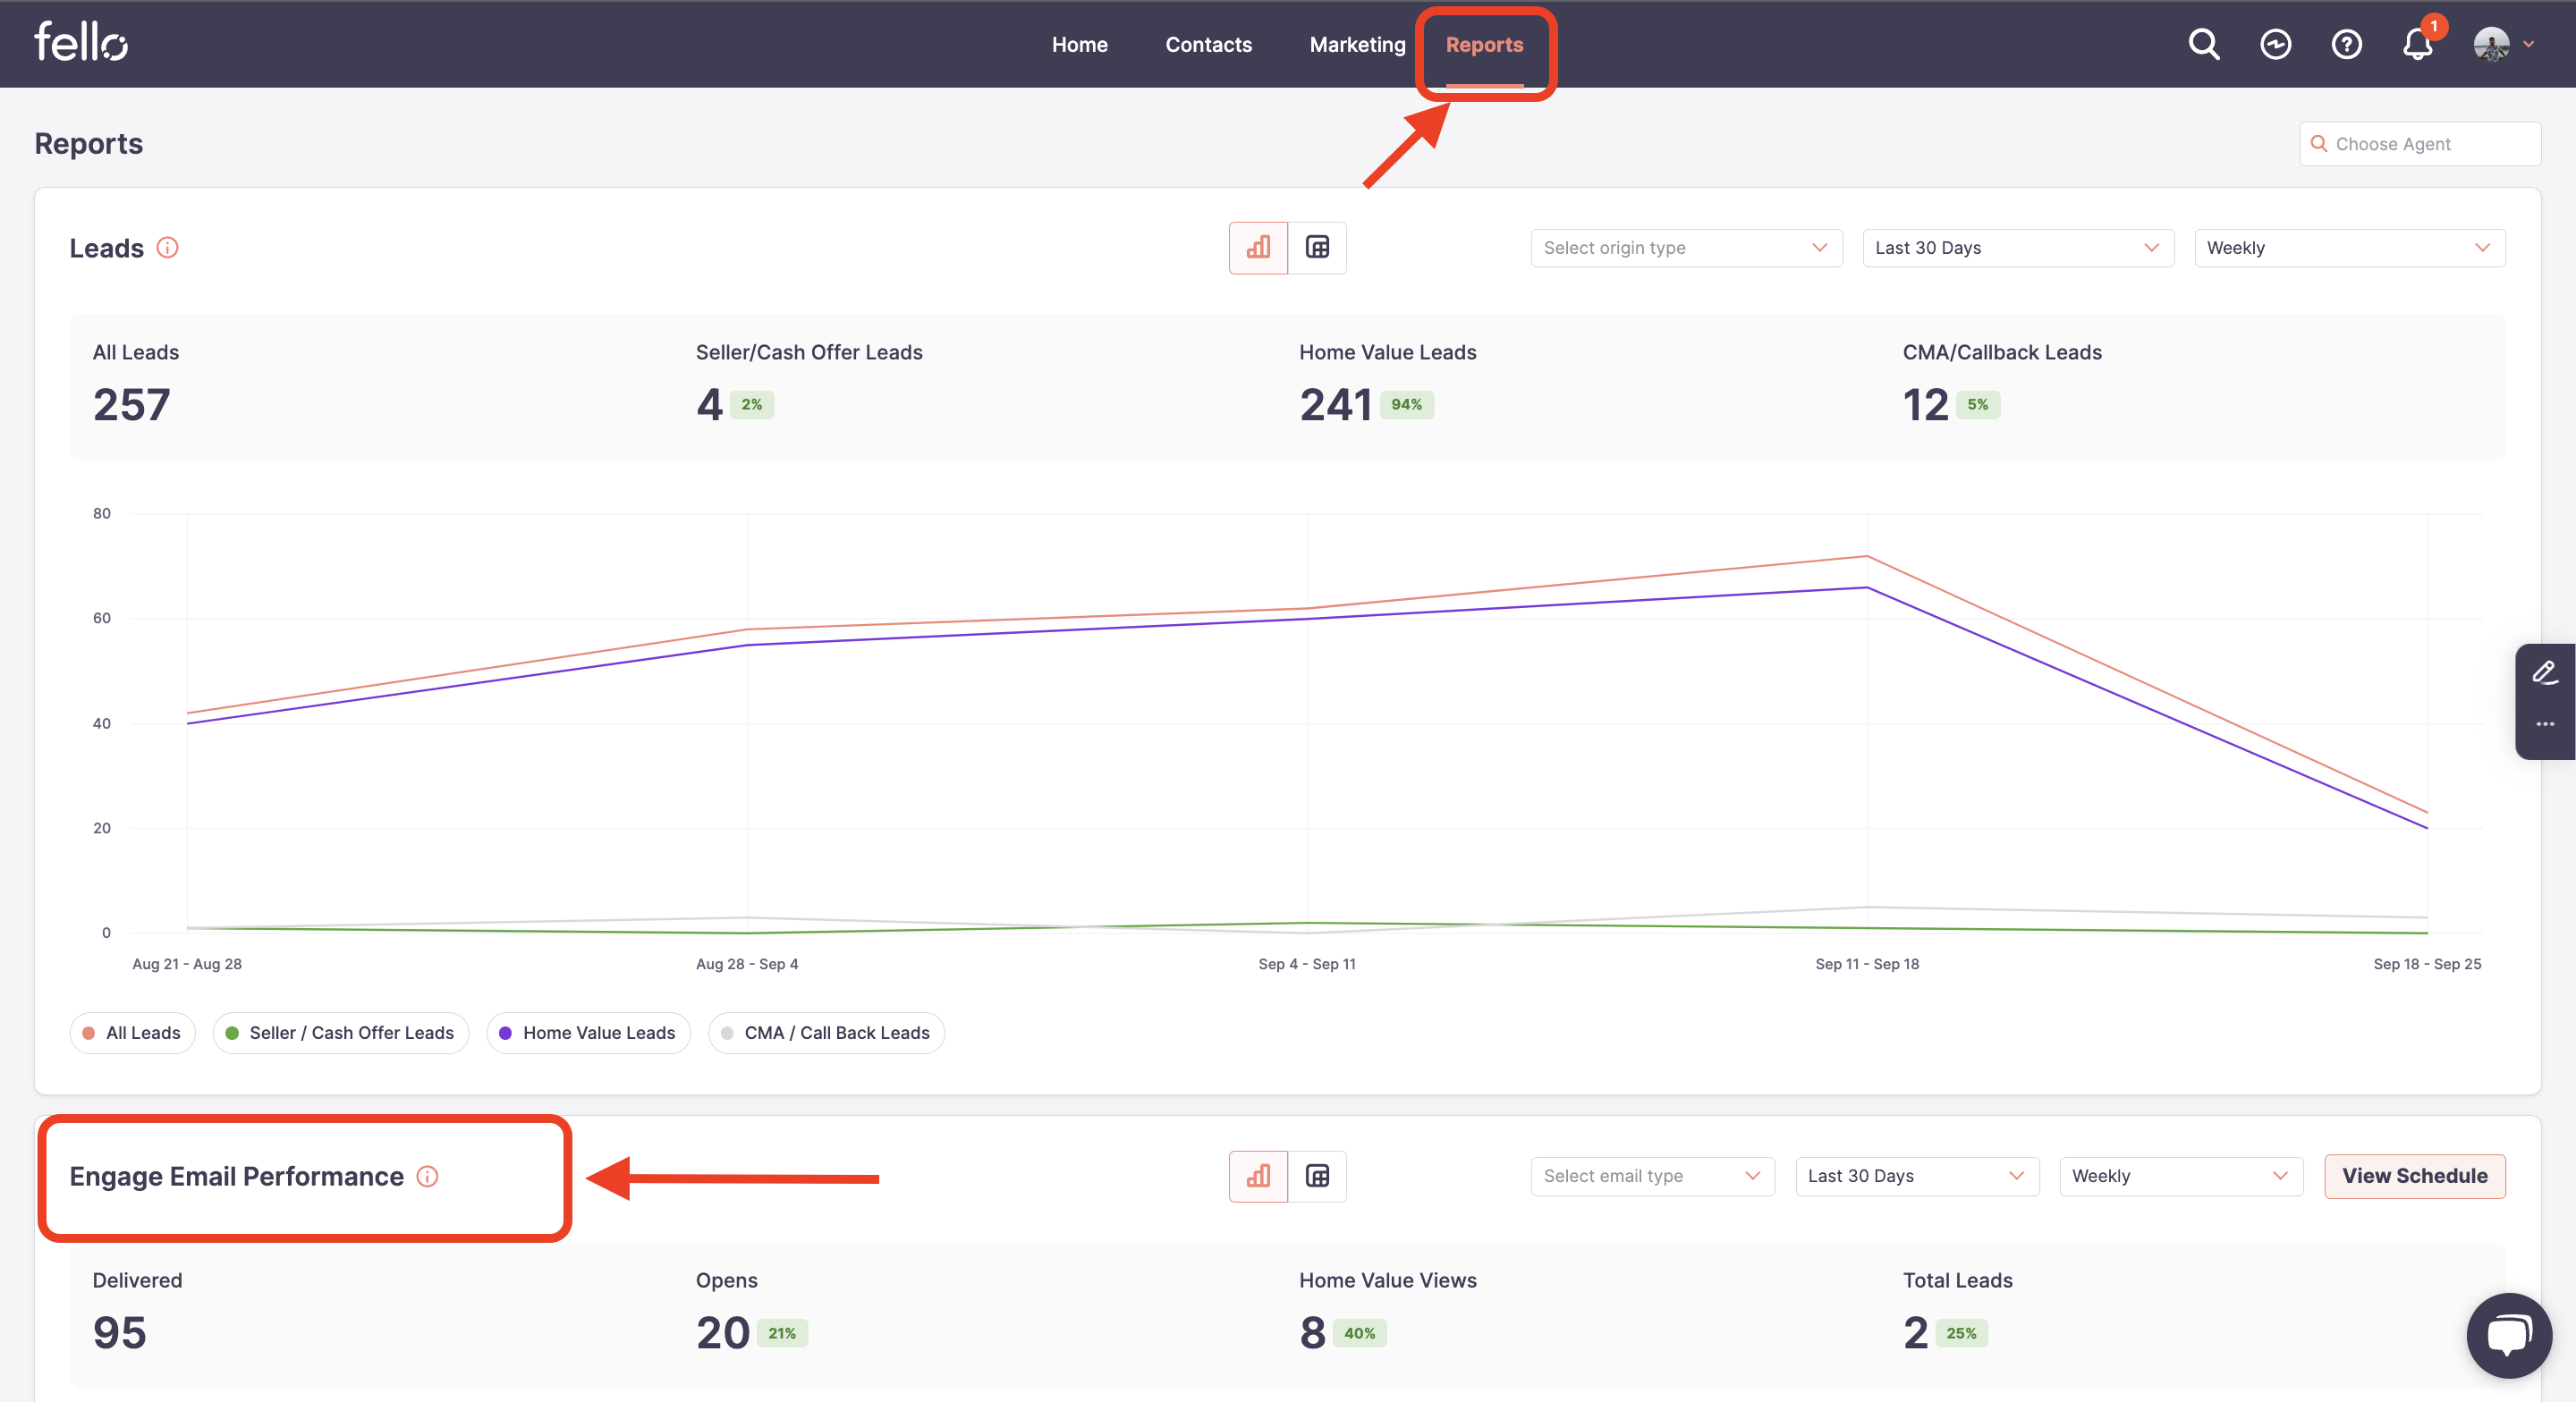
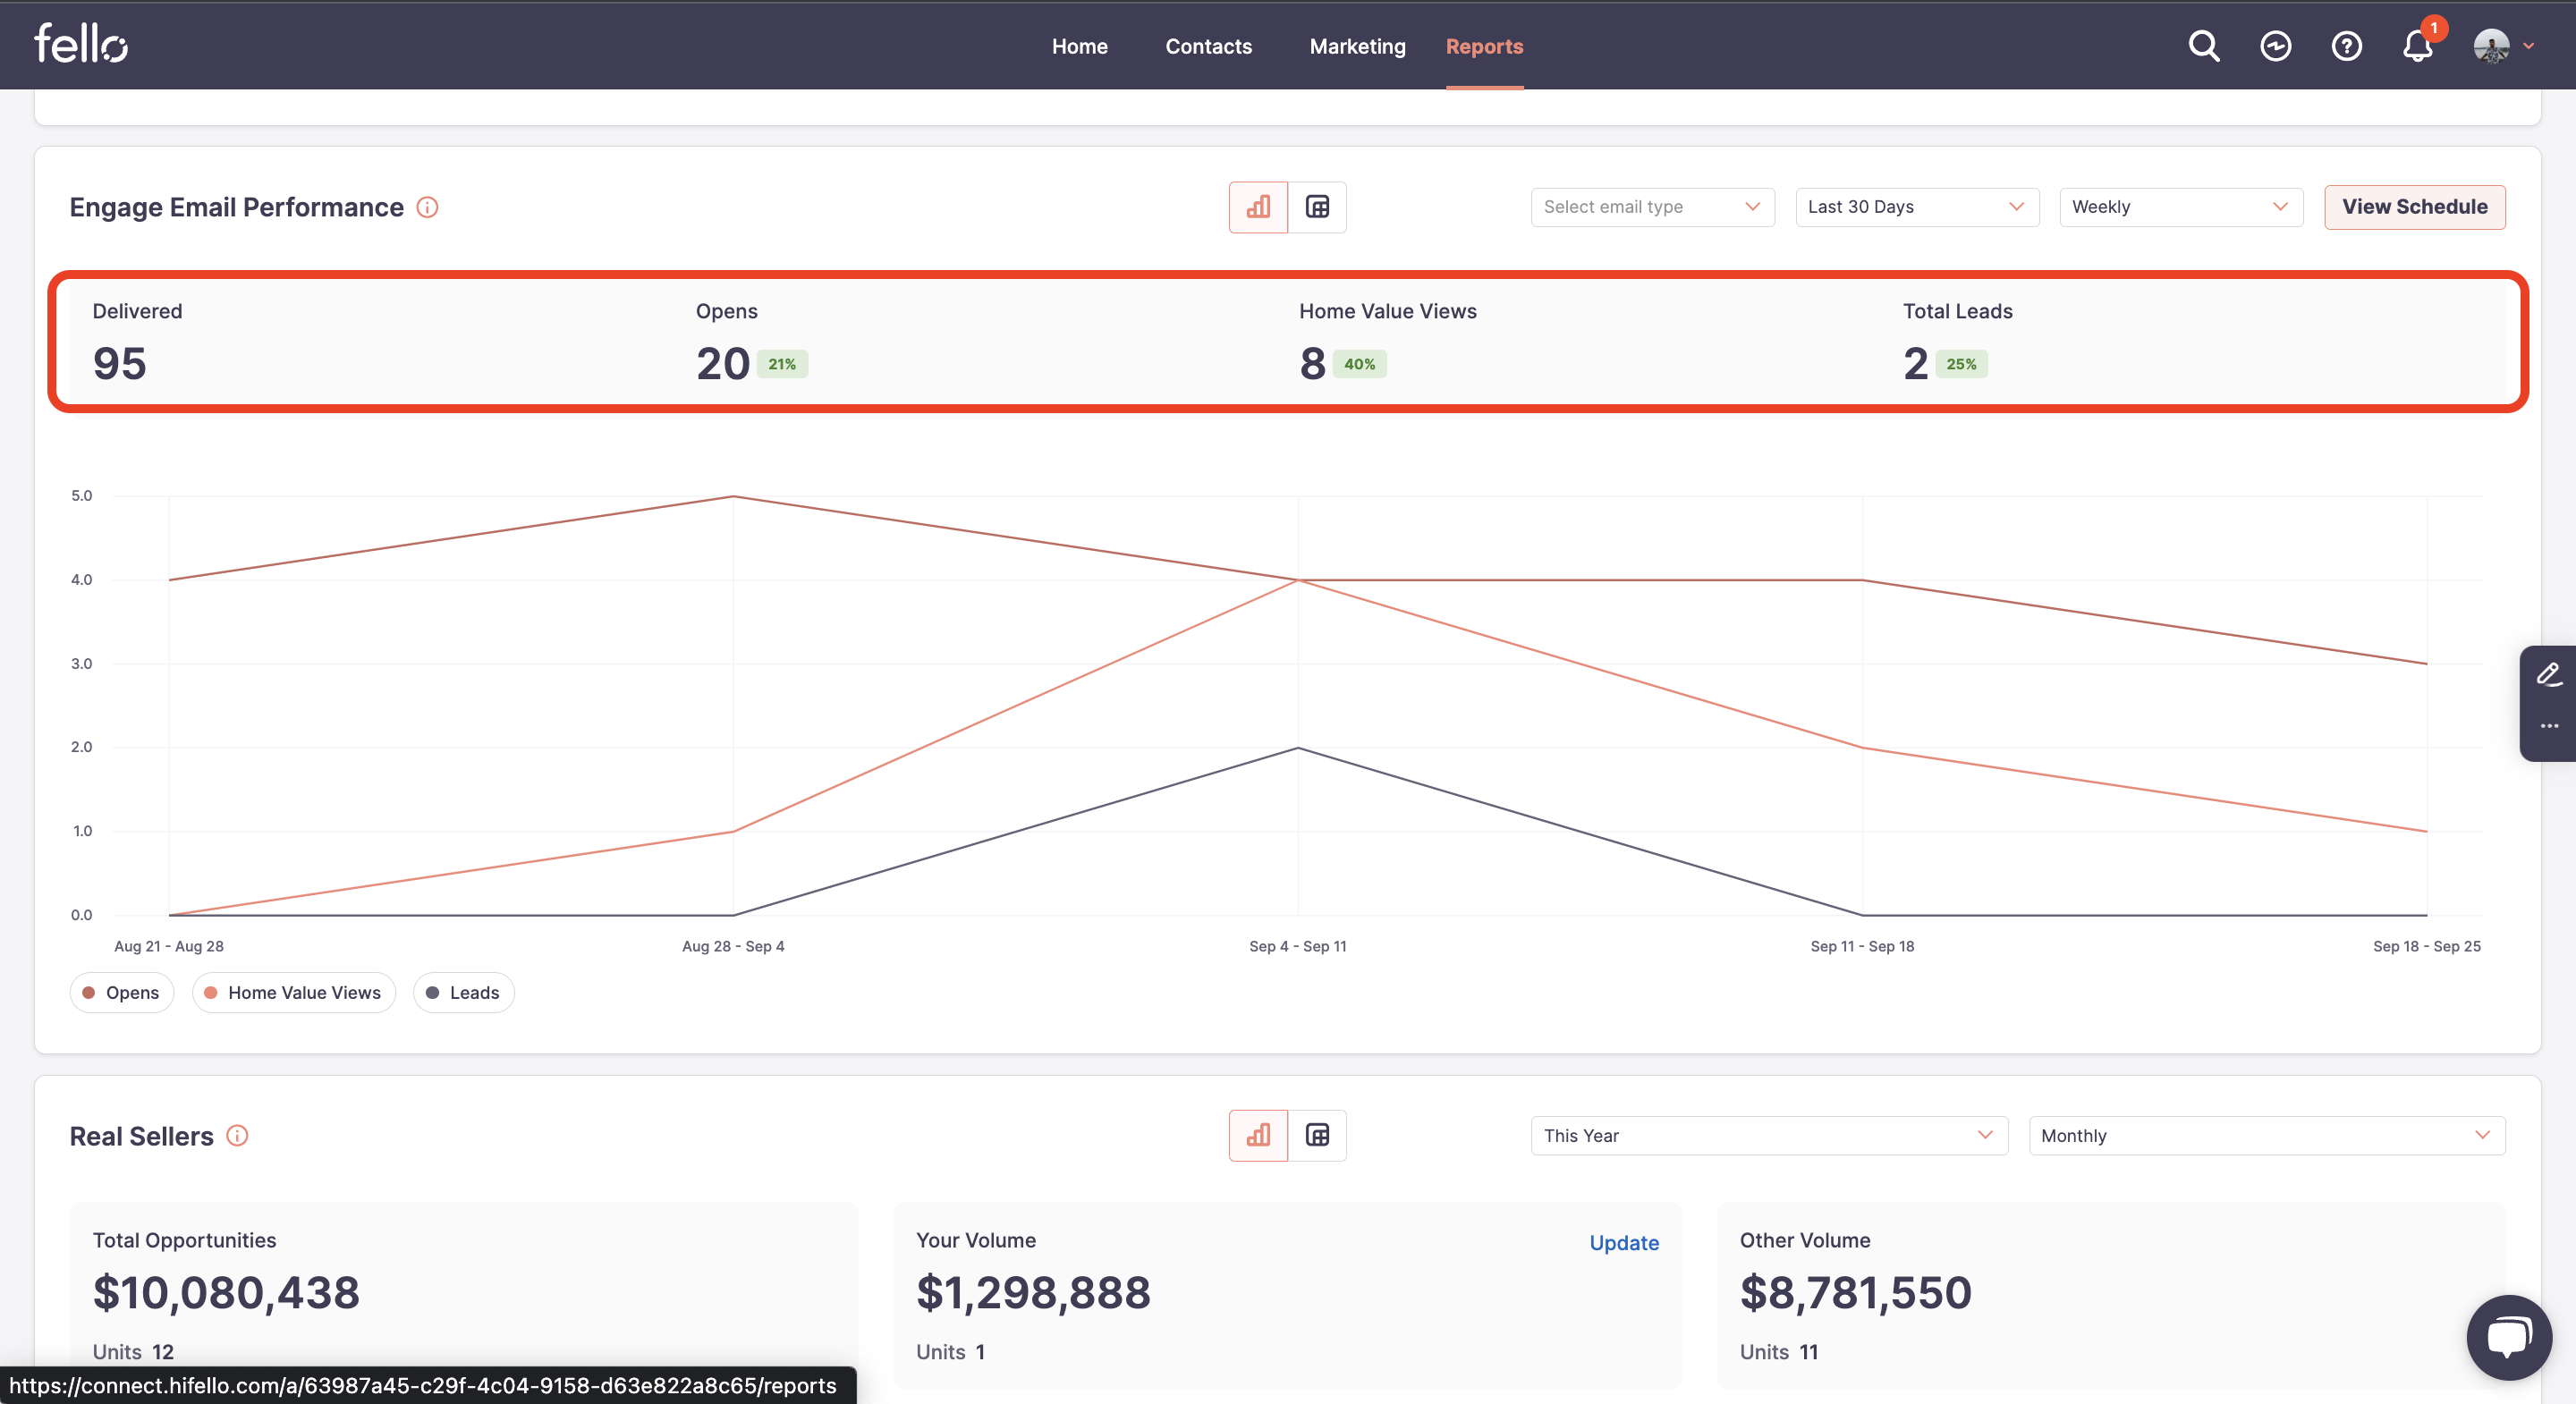
In the Engagement section, you will be able to see number of emails delivered, total opens, and total clicks, as well as how many leads were generated through Engage.
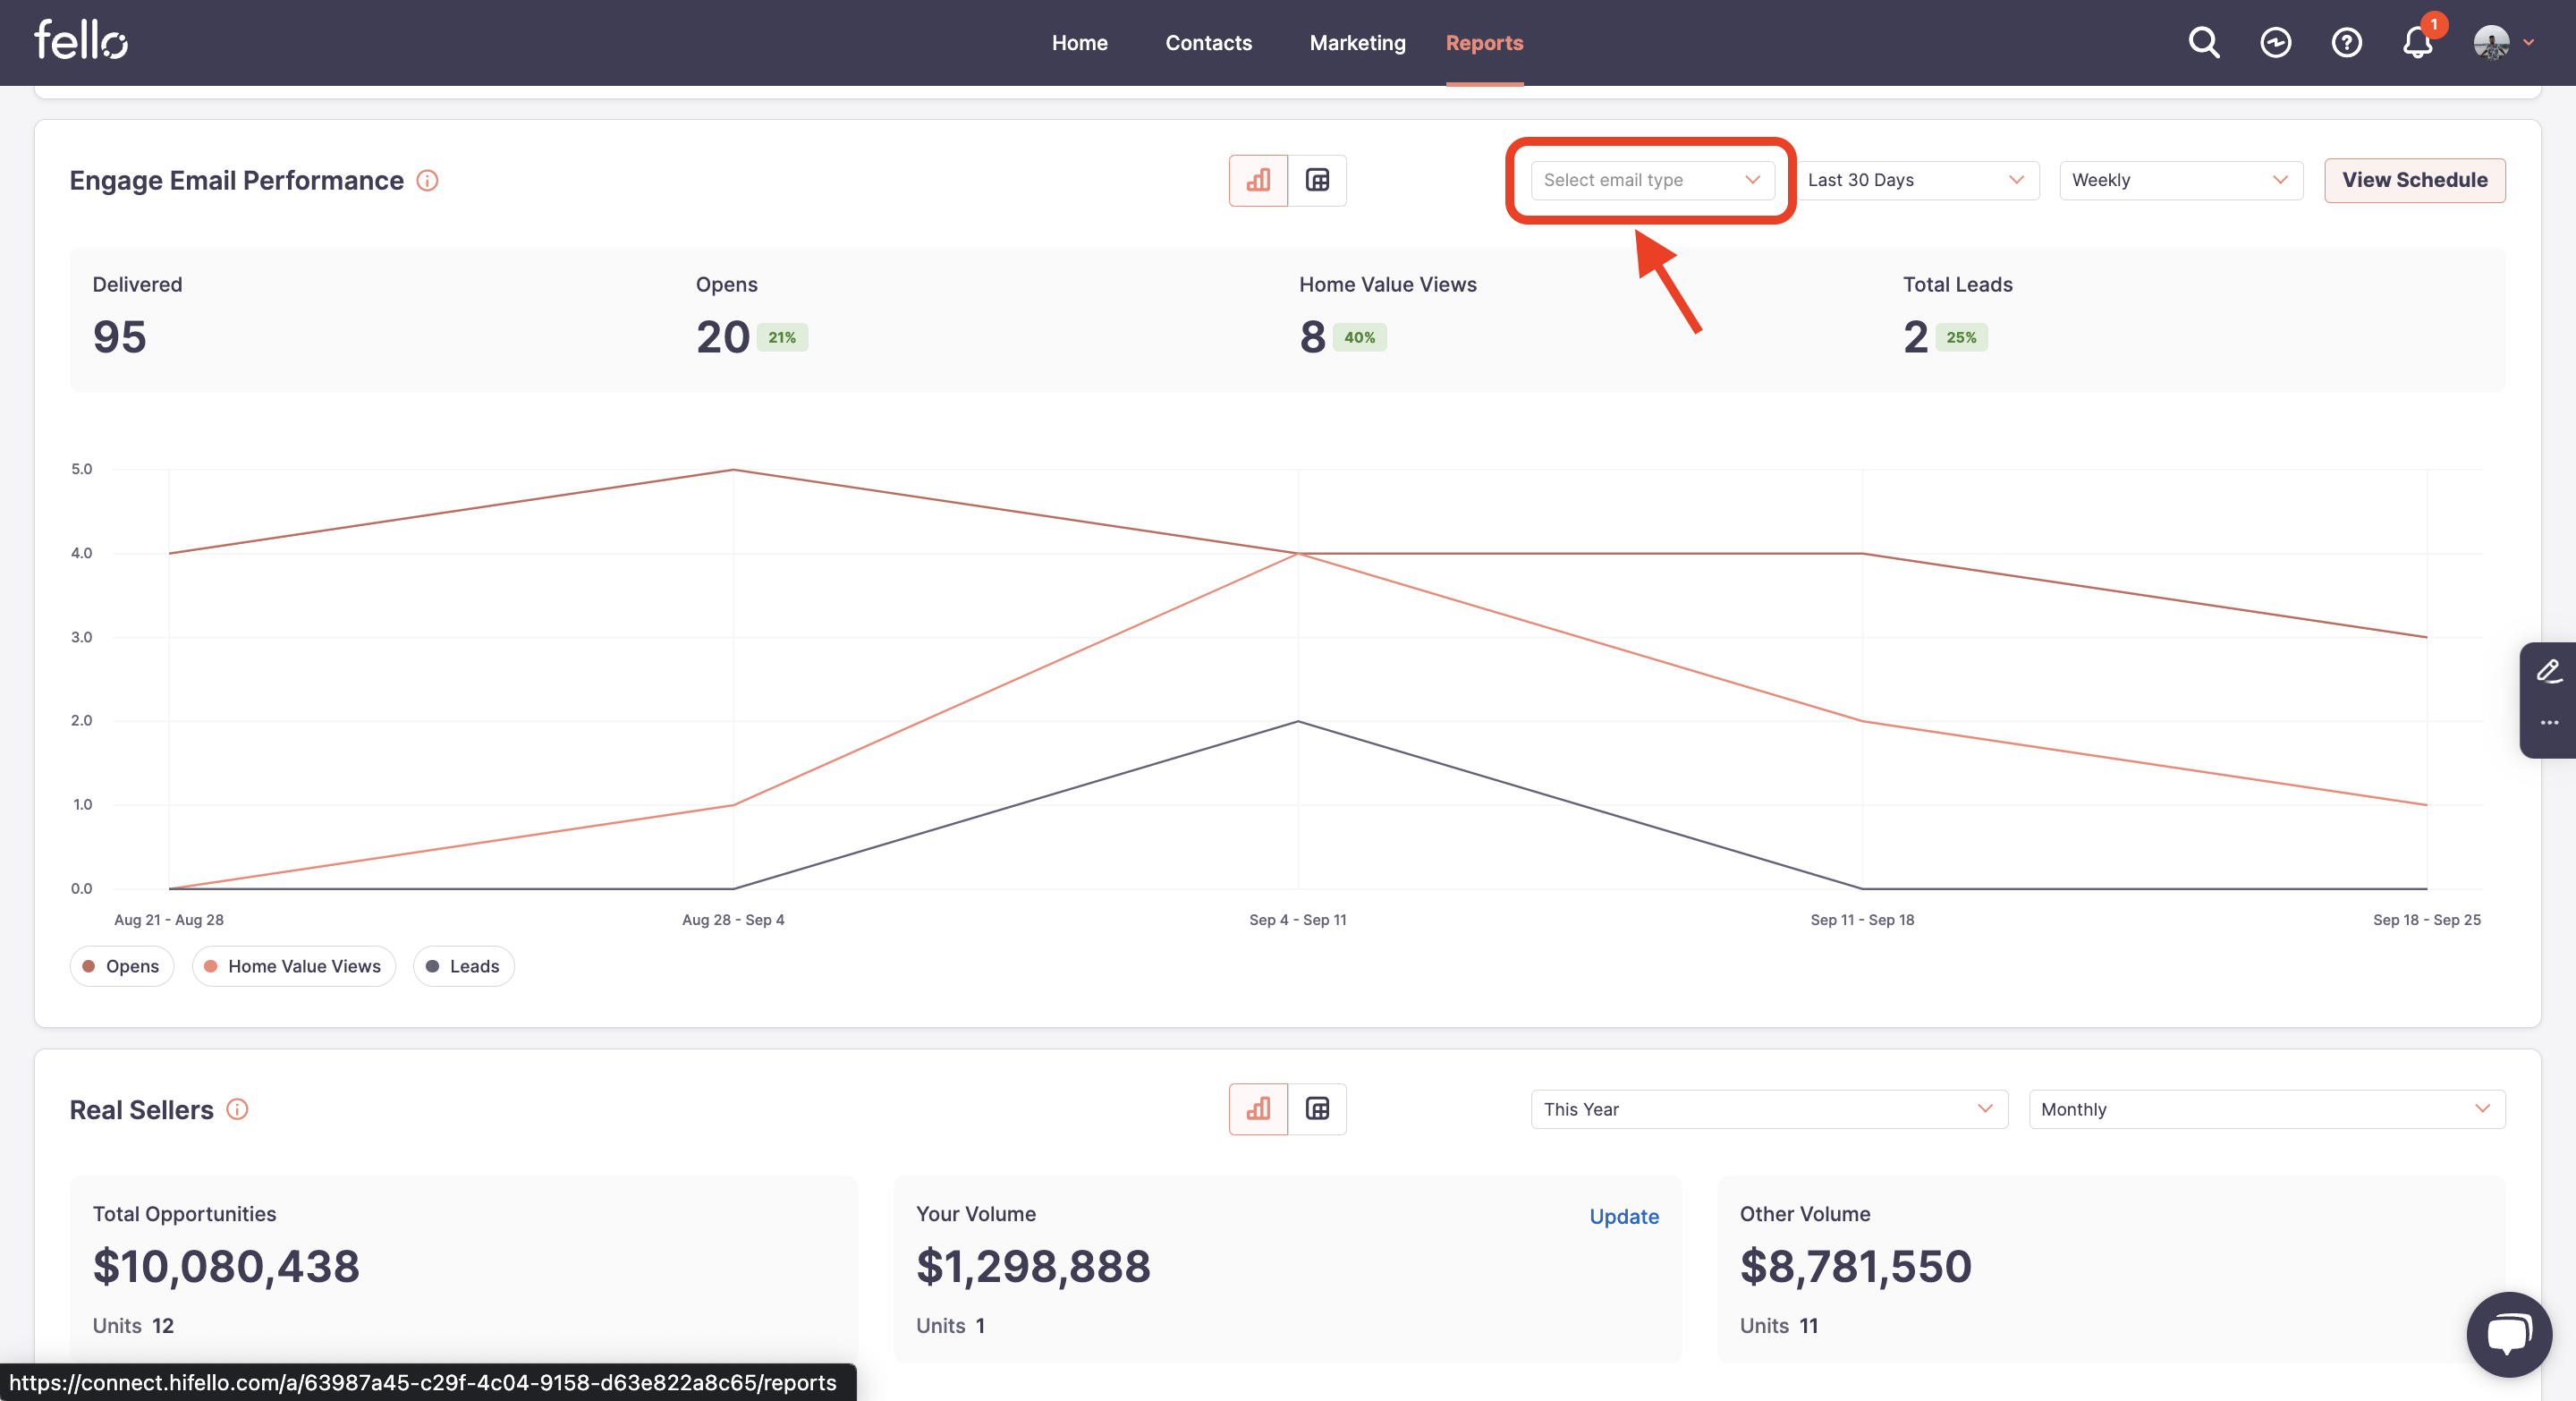
In addition to time period, you can filter by email type. Select the email type that you want to view Engage metrics for from the dropdown menu. Choose from welcome, home value, or market update emails.
The default report is displayed in chart format but you can switch to tabular data format by clicking on the table icon.
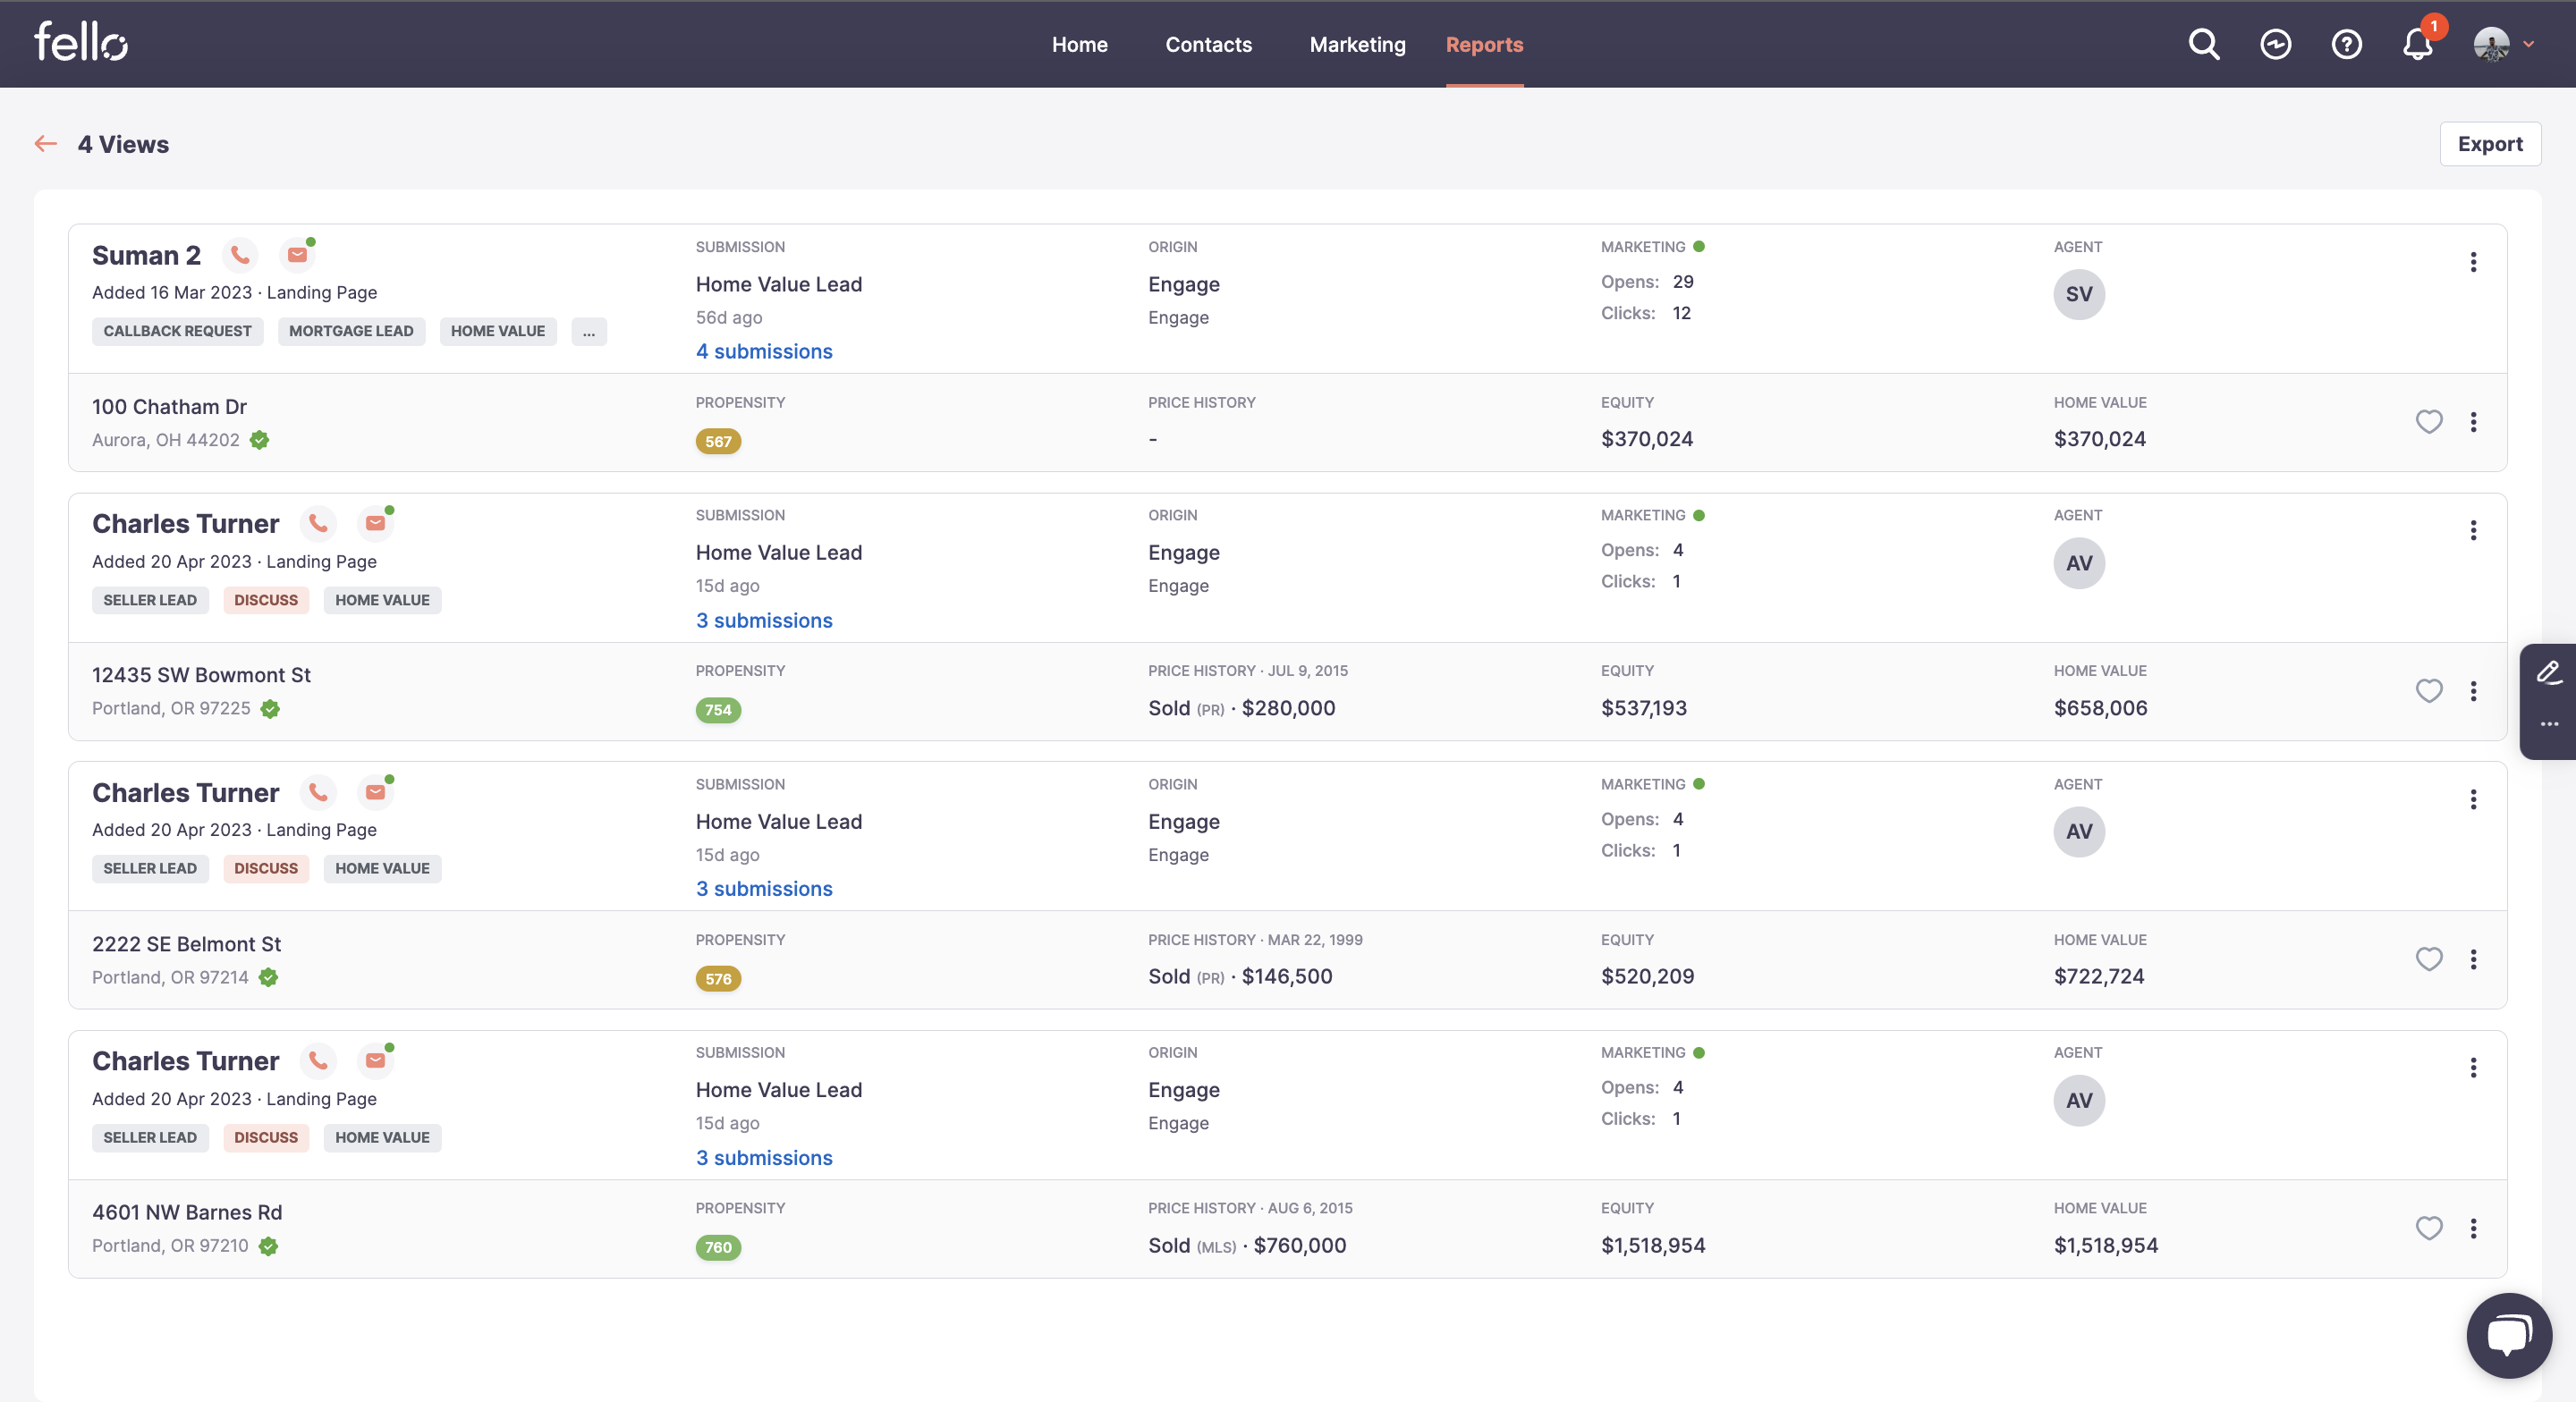
The tabular data is shown for each week and the data view can be changed by clicking on the Weekly dropdown to change the data viewing timeline. To view contact level data of which contacts opened email, viewed home value, leads were generated, you need to click on the number and the data will be opened in a full page.